

In our lives, we are surrounded by information and graphs are used to represent information. That is why it is important to know how to represent graphs. Not only is it ideal to know how to read and interpret them, but it also helps to know if someone is trying to deceive us when presenting data graphically.
In this blog post, you will learn how to represent real world information with graphs, and also how to interpret that information. Plus there’s also something special in store, keep reading because you will be able to download a fantastic free book to continue learning about graphs.
Index
Teaching Graphs Early
Traditionally, graphs have been taught in high school but there are many reasons to introduce them earlier, as we do at Smartick:
- Development of logical and abstract thinking: Visual representations help students understand mathematical relationships and patterns, laying the foundation for advanced math skills
- Real-World Connection: Graphs and functions are powerful tools for analyzing real-world phenomena. Introducing these concepts early helps relate math to everyday situations, making it more relevant and meaningful.
- Preparation for Advanced Levels: Early introduction provides a solid foundation for understanding more advanced concepts in math and science. By the time students reach high school, they already have a basic understanding of graphs and functions, which eases the transition to more complex concepts.
- Problem-Solving Skills: Students learn to interpret information, identify patterns and make data-driven decisions, which are essential skills for everyday life and future careers.
- Fostering creativity: students can explore different ways of representing data and mathematical concepts, allowing them to think creatively and find innovative solutions.
- Reducing math anxiety: Familiarity with these concepts from a young age can reduce math anxiety, making students more comfortable with math at more advanced stages.
- Focus on the learning process: Emphasis is placed on the learning process and deep understanding instead of only outcomes. This aligns with modern, effective pedagogical approaches in modern education.
Representing Values on Graphs
At Smartick we introduce the reading and interpretation of graphical situations very early, with exercises that start by placing points on the coordinate axis system. For example, if you have to place the point (3,2) you have to move up 3 on the horizontal axis (x-axis) and up 2 on the vertical axis (y-axis). Even before this, our youngest students begin by placing objects on coordinate grids using simple tables, like in the game Battleship.
Function Graphs
Sometimes, there’s a known relationship between two variables, such as the cost of tomatoes per kilogram (e.g., $2 per kg). This can be represented on a graph. We saw it in the blog post on Mathematical Functions.
Drawing the graph of this function is straightforward because it shows a direct proportionality (if you buy double, it costs double; if you buy half, it costs half). This relationship forms a straight line on the graph.
To draw a straight line we only need to know a couple of points through which it passes. This particular example we have given is especially simple. If I don’t buy anything it won’t cost me anything. It passes through the origin of coordinates, I just need to know another point, for example that if I buy a kilo, I will spend two dollars:
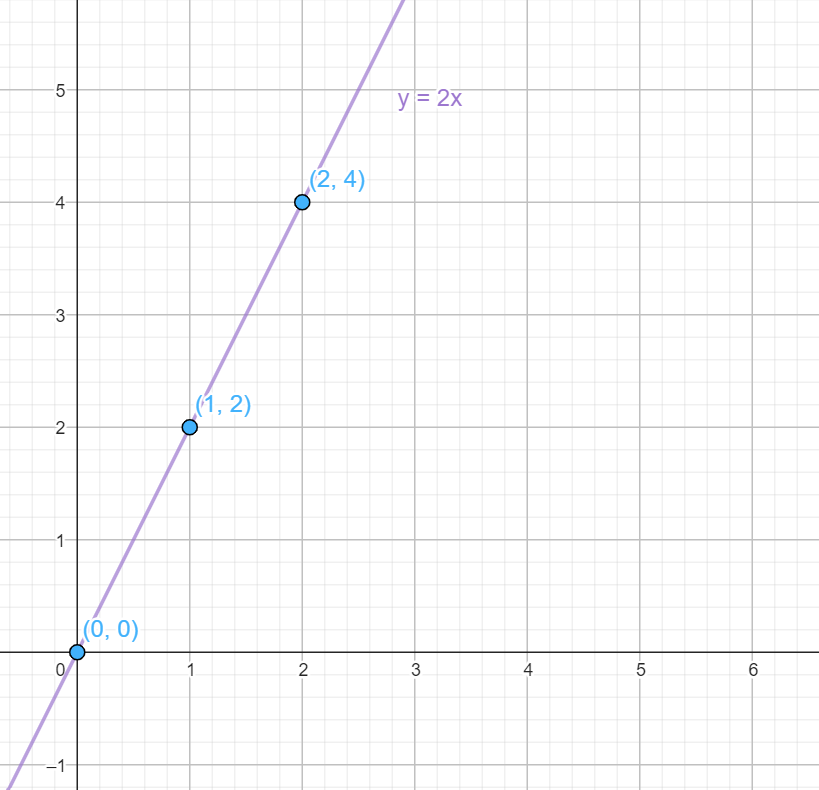
Even though this graph is easy to create, it’s important to know how to read it. It not only shows the points we have plotted, but also allows us to determine the cost of buying a different quantity of tomatoes by looking at the height above that quantity on the graph. For example, if the graph passes through the point (2,4), it means that two kilograms will cost 4 dollars. Similarly, we can use the graph to find out the weight of tomatoes we can buy for 3 dollars by looking for the point on the horizontal axis that corresponds to a height of 3 on the vertical axis.
We can see the importance of being able to read graphs, as well as draw them accurately. However, we must be careful not to deceive ourselves. Real-life situations rarely produce simple straight-line graphs. In fact, most graphs are far more complex. Drawing a graph involves more than just “connecting the dots”.
Learning about Graphs at Smartick
We want to show you some exercises from our graph module, to exemplify what we were saying in the previous paragraph, that learning about graphs and functions is not just about “connecting the dots”.
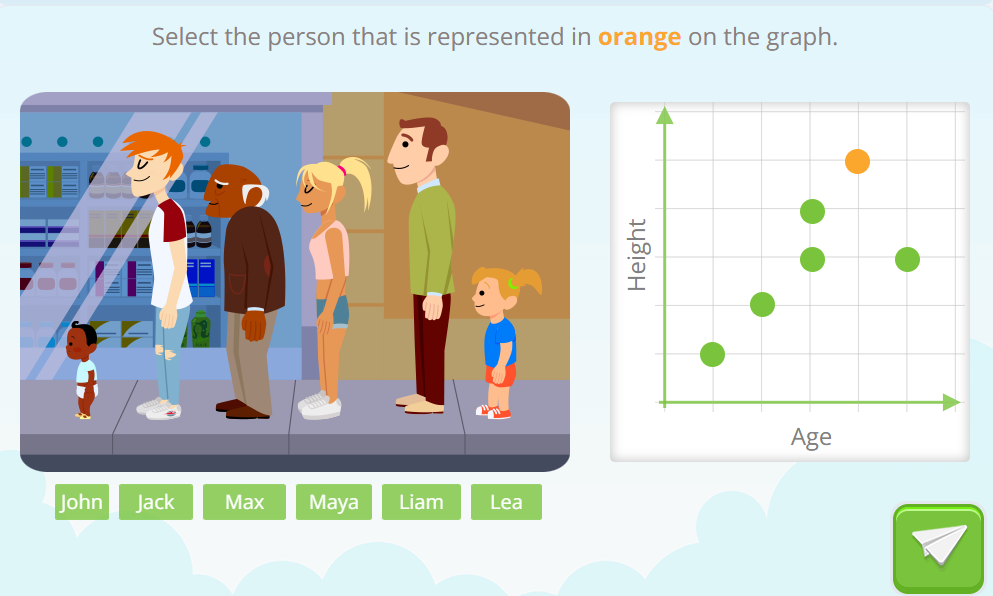
We found a few people standing in line, we also found a graph in which we looked at two aspects of those people: their height and their age. Of course, we could look at other details, such as the color of their hair or the clothes they are wearing. But these two variables that we have observed allow us to draw them on a graph in which, we see that there is a “functional” relationship: older people are taller… yes, but not always… This is a very real example:
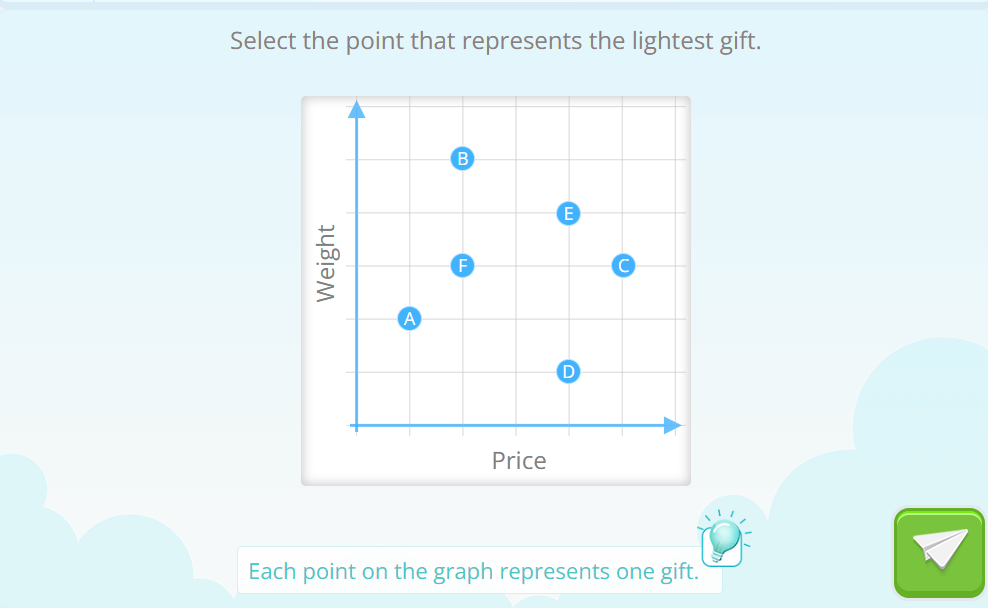
Later on in the same learning trajectory we will encounter very similar problems but expressed in more abstract contexts, without such a clear reference as the image of the people in line:
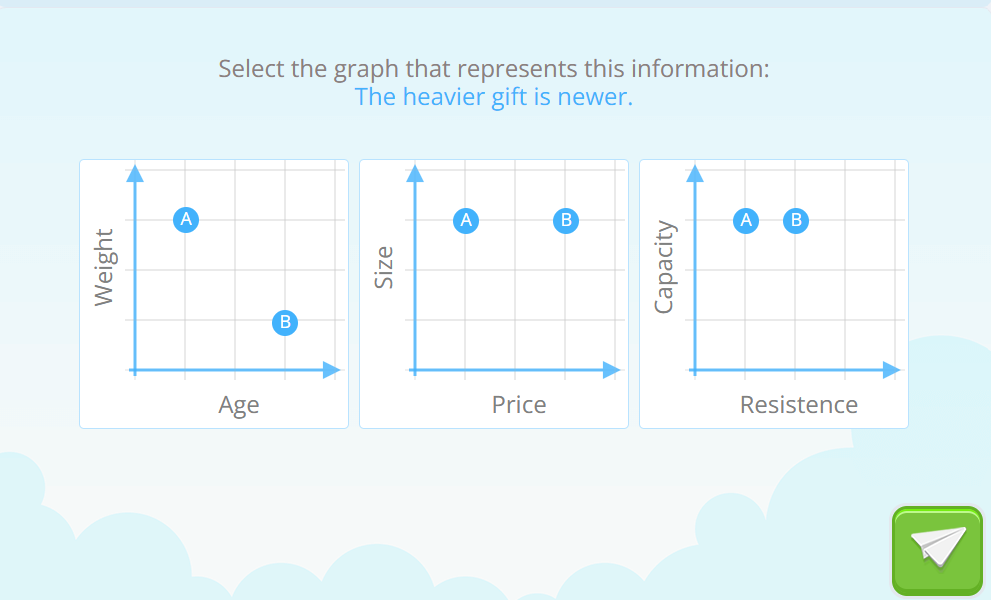
At the end of the module, students will have to cross-reference information between several graphs to demonstrate their understanding of these relationships:
The Language of Functions and Graphs
At Smartick, we stay updated with the latest research and educational trends. One inspirational resource is the book “The Language of Functions and Graphs,” published in 1985 by the Shell Centre for Mathematical Education. It’s available for free download and offers excellent examples, although some have become outdated over the years. This book is a true gift.
We hope you found this post interesting. Feel free to share it or leave comments with your questions or topics you’d like to learn more about. To continue learning, register with Smartick, the online math learning method for children aged 4 to 14.
Learn More:
- Mathematical Functions: Do You Know What They Are?
- Symmetry: What It Is And How to Find It
- What Is a Fraction? Definition and Various Meanings
- Word Problems: Levels of Difficulty in Mathematical Language
- Identifying Flat Symmetrical Figures


A multidisciplinary and multicultural team made up of mathematicians, teachers, professors and other education professionals!
They strive to create the best math content possible.