Tables are perfect for organizing all kinds of information and for looking at results with more clarity. Using pictures makes it easier to comprehend tables faster and this is why pictograms help us interpret data more easily.
At Smartick, we start children with pictograms at a young age so that they can learn how to compare numbers. Later on, they’ll return to use pictograms when they confront mathematical problems since visualizing helps them comprehend the problem better and solve it faster.
Tables with Pictograms for Comparison:
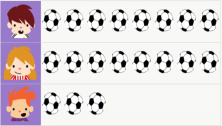
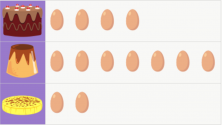
Here are 5 different examples with pictograms where students have to respond to the indicated question.
Example 1: Who has the most marbles?

Example 2: Which one is the least?

Example 3: Who has scored the same number of goals?

Example 4: How many eggs are needed to make a cake?

Example 5: Who has exactly 2 doughnuts?

Tables with Pictograms for Word Problem Comprehension:
Example 1: I am bowling. On my first try, I knocked down 5 bowling pins and on my second try I knocked down 2. How many bowling pins did I knock down on my first try? How many bowling pins did I knockdown in total?

Example 2: In Charles’ ecological garden, there are 9 watermelons and 3 tomatoes. How many more watermelons are there than tomatoes?

These are some examples of pictogram activities that we have at Smartick. Did the pictograms make it simpler for you to solve the problems? Let us know in the comments!
Learn More:
- Math Problems with Data Tables
- Applying the Commutative Property of Addition and Multiplication in a Problem
- What Do Double and Half Mean?
- Quick Multiplication Tricks for Fast and Effective Math
- Examples of Equivalent Fractions


