

The latest data released by the Nation’s Report Card shows a significant drop in student performance in math achievement across the United States. This drop is the first of its kind since 1978 — when the NAEP began collecting assessment data—and is a direct result of the COVID-19 pandemic. While these current scores unmistakably spotlight the serious impact a global pandemic has on learning, they also provide valuable insight on the vulnerabilities of the American education system itself, such as how learning is accessed and to whom it is accessible.
Run by the U.S. Department of Education and the National Center for Education Statistics, the Nation’s Report Card provides a snapshot of student performance across the country in grades 4 and 8.
Despite a brief setback of budget cuts in 2000 and again in 2016, this national assessment is the longest-running test of student achievement in math and reading in the nation’s history. It strives to be statistically representative of the nation as a whole by selecting sample schools across the country based on ethnicity, school size, location, economic background, and gender.
Although standardized testing is not considered a paragon of evaluation, it can still serve as a basic tool to monitor a country’s academic pulse, to highlight needs and inequalities, and to measure progress over long periods of time.
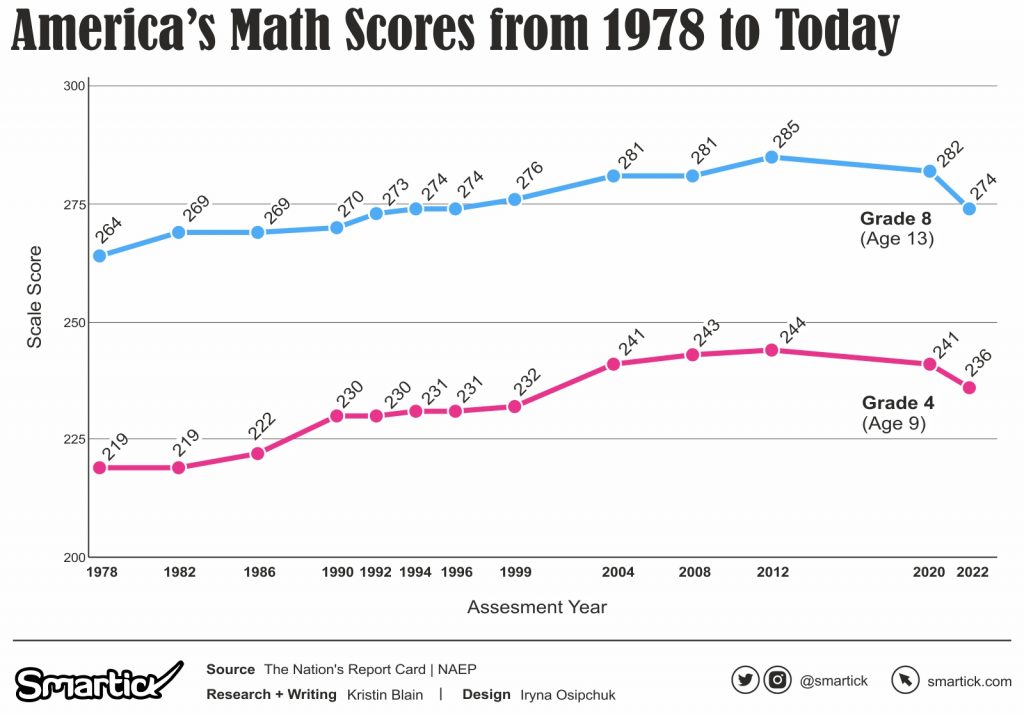
The long-term trends of mathematics on the Nation’s Report Card show steady, upward progress since 1978. However, due to school shutdowns and the incongruous shifts to remote learning during the COVID pandemic, this upward progress was halted—and reversed.
Most recently, the exam was administered between January and March of 2022. During this time, a sample of nearly 450,000 fourth and eighth graders in more than 10,000 schools nationwide participated.
In the fall of 2022, the NAEP’s report published the grimmest data to date: nationwide, Grade 8 students dropped an average of eight points while Grade 4 students dropped an average of 5 points in just two years’ time.
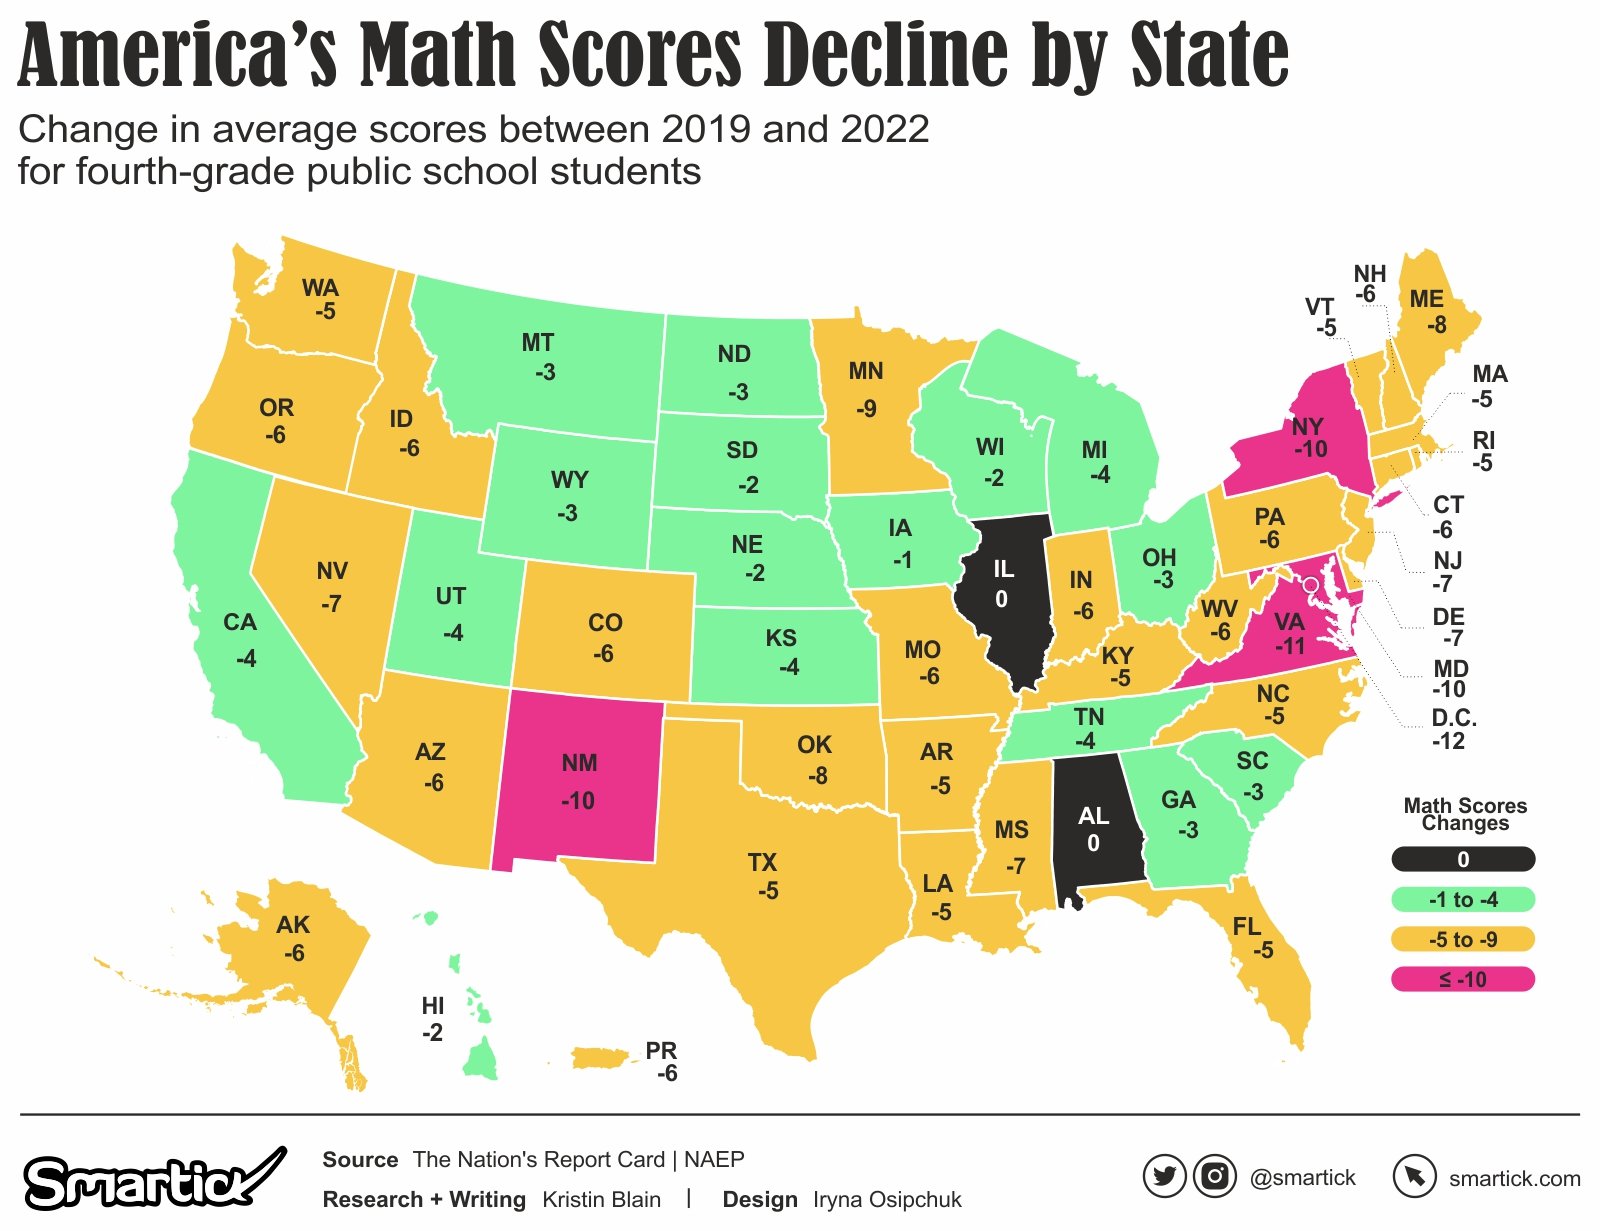
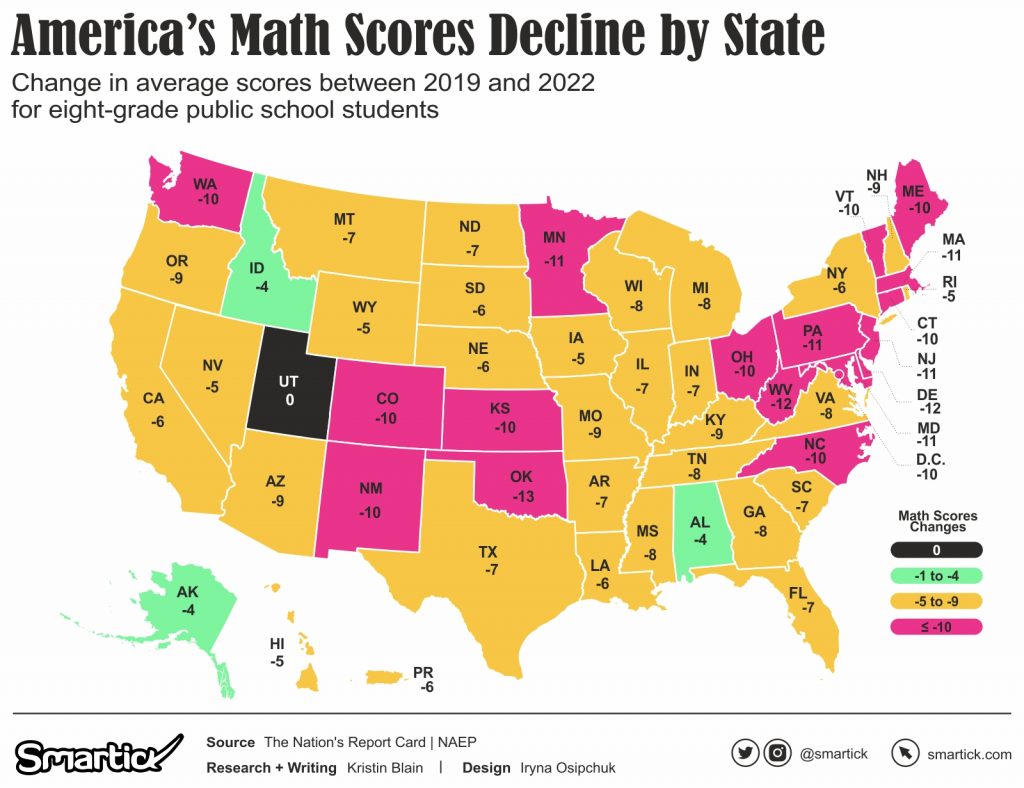
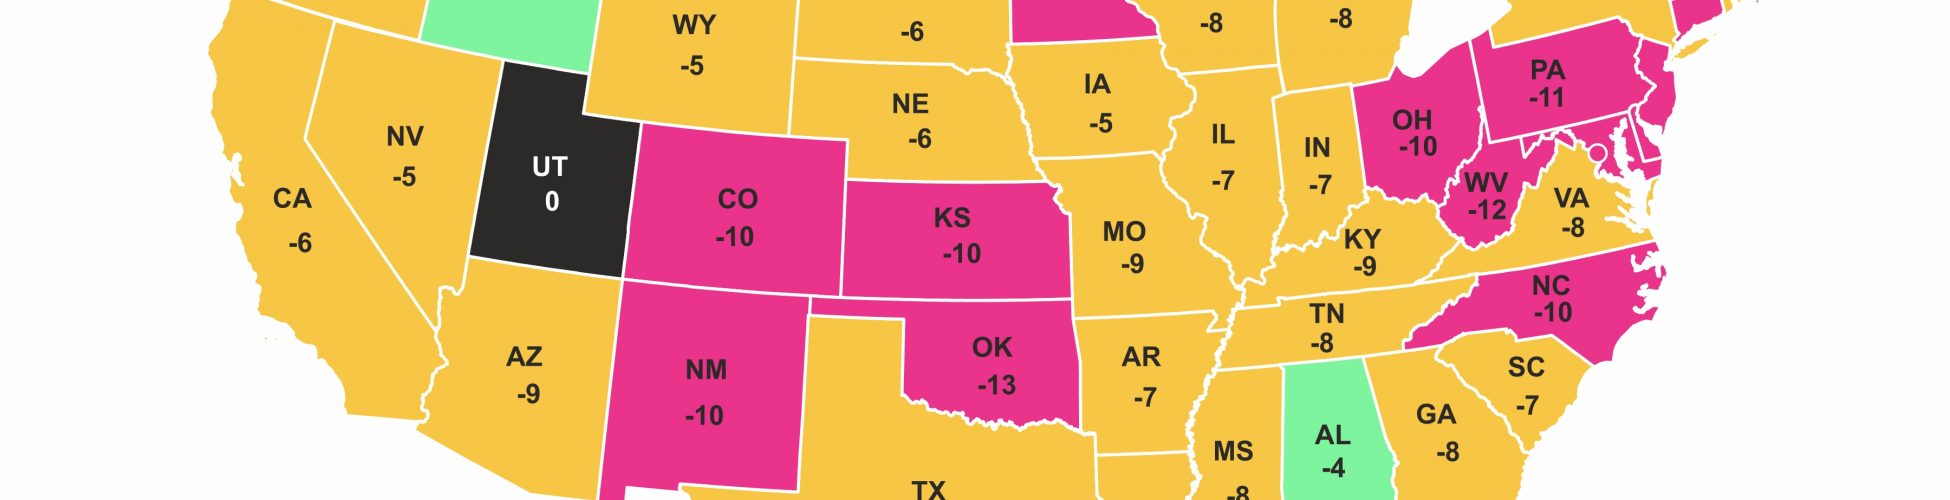
The 2022 assessment data showed that while some states were able to hold steady in their reading scores, the most dismal declines occurred in math, where no state or jurisdiction was left untouched.
The District of Columbia, Virgina, Maryland, New Mexico, Delaware, and New York saw double-digit score declines in Grade 4 while a whopping thirteen states—including historically high-performing districts such as Massachusetts and New Jersey— suffered double-digit declines in Grade 8.
The 2022 national percentage at or above “proficient” in mathematics was 35% in Grade 4 and 26% in Grade 8, with 16 states performing higher than the national level and all remaining states and jurisdictions falling below the national average.
While this data gives an overview of the situation for each state since the pandemic began, researchers caution against drawing any fast conclusions due to the fact that academic calendars, school closings, remote learning time, and virus transmission rates varied from district to district and state to state. Other factors such as poverty levels and state-specific education policies might also influence results.
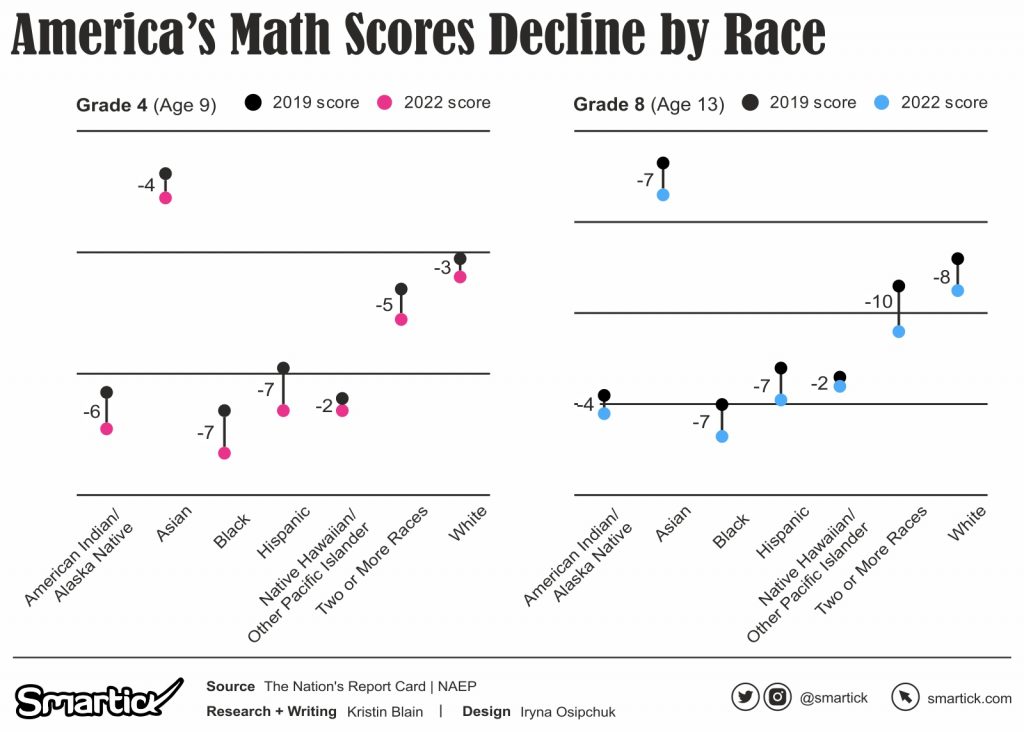
When broken down into student demographics, the detrimental decline in math scores paints a new sobering reality; one that plainly shows how the inequalities within the American education system are quickly compounded during a national crisis.
For the country’s most vulnerable students, the pandemic has left them even further behind—and in some cases, the gap between white and BIPOC students has grown.
In Grade 8, mixed race students fell an average of 10 points from 2019 to 2022 while Black, Native, and Hispanic eighth graders fell an average of 7 points nationwide. In 2019, BIPOC students averaged scores of 270 points while white eighth graders averaged scores of 292 points. In 2022, the gap persisted at 22 points with BIPOC students scoring an average of 263 and white students an average of 285.
In the fourth grade, BIPOC students fell 7 points from 2019 with an average score of 226, while their white peers fell 3 points for an average score of 246. In just two years, this gap widened by an additional 2 points from 18, for a staggering difference of 20 points between white and BIPOC fourth graders in 2022.
While these bleak results underscore how closing schools and turning to remote learning hurt students and greatly impact academic achievement, they can also serve in the preparation of a deeper analysis which can help to inform educational recovery plans for every state and student demographic.